Valid PL-300 Dumps shared by PassLeader for Helping Passing PL-300 Exam! PassLeader now offer the newest PL-300 VCE dumps and PL-300 PDF dumps, the PassLeader PL-300 exam questions have been updated and ANSWERS have been corrected, get the newest PassLeader PL-300 dumps with VCE and PDF here: https://www.passleader.com/pl-300.html (387 Q&As Dumps –> 431 Q&As Dumps –> 467 Q&As Dumps)
BTW, DOWNLOAD part of PassLeader PL-300 dumps from Cloud Storage: https://drive.google.com/drive/folders/1DTxKJGzNsJ4r5NDQC2vCwfjY0k1ytMgJ
NEW QUESTION 361
From Power Query Editor, you attempt to execute a query and receive the following error message:
“Datasource.Error: Could not find file.”
What are two possible causes of the error? (Each correct answer presents a complete solution. Choose two.)
A. You do not have permissions to the file.
B. An incorrect privacy level was used for the data source.
C. The file is locked.
D. The referenced file was moved to a new location.
Answer: AD
Explanation:
https://learn.microsoft.com/en-us/power-query/dealing-with-errors
NEW QUESTION 362
You have a CSV file that contains user complaints. The file contains a column named Logged. Logged contains the date and time each complaint occurred. The data in Logged is in the following format: 2018-12-31 at 08:59. You need to be able to analyze the complaints by the logged date and use a built-in date hierarchy. What should you do?
A. Apply the Parse function from the Data transformations options to the Logged column.
B. Change the data type of the Logged column to Date.
C. Split the Logged column by using at as the delimiter.
D. Create a column by example that starts with 2018-12-31.
Answer: C
NEW QUESTION 363
You use Power Query to import two tables named Order Header and Order Details from an Azure SQL database. The Order Header table relates to the Order Details table by using a column named Order ID in each table. You need to combine the tables into a single query that contains the unique columns of each table. What should you select in Power Query Editor?
A. Merge queries.
B. Combine files.
C. Append queries.
Answer: A
NEW QUESTION 364
You have a Power BI model that contains a table named Date. The Date table contains the following columns:
– Date
– Fiscal Year
– Fiscal Quarter
– Month Name
– Calendar Year
– Week Number
– Month Number
– Calendar Quarter
You need to create a calculated table based on the Date table. The calculated table must contain only unique combinations of values for Calendar Year, Calendar Quarter, and Calendar Month. Which DAX function should you include in the table definition?
A. ADDCOLUMNS
B. CALCULATE
C. SUMMARIZE
D. DATATABLE
Answer: C
Explanation:
– SUMMARIZE: “Creates a summary of the input table grouped by the specified columns.”
– ADDCOLUMNS: “Returns a table with new columns specified by the DAX expressions.”
Based on this, using SUMMARIZE will give us the unique combination we want and don’t need to use DAX expressions to create the calculated table.
NEW QUESTION 365
You publish a dataset to the Power BI service. The dataset contains a connection to an on-premises Microsoft SQL Server database. You attempt to configure a scheduled refresh but cannot select the appropriate on-premises data gateway. You confirm the following with the administrator of the gateway:
– You have the appropriate permissions to use the gateway.
– The data source was created on the gateway.
– The gateway has a status of Running.
What is the most likely reason the gateway is unavailable?
A. The type of data source is not supported by the on-premises data gateway.
B. The server name in the PBIX file does not match the data source name in the gateway.
C. The credentials for the data source are invalid.
D. The data source is configured to use single sign-on (SSO).
Answer: B
Explanation:
In Power BI, when you configure a data source to use an on-premises data gateway, the server name and other connection details in your PBIX file must match the data source configuration in the gateway. If there’s a mismatch in the server name or other connection details, the scheduled refresh won’t work, and you won’t be able to select the appropriate gateway.
NEW QUESTION 366
You have a Power BI model that contains two tables named Population and Date. The Population table contains two columns named PopulationAmount and DateKey. DateKey contains date values that represent the first day of a year and are used to create a many-to-one relationship with the Date table. The Power BI model contains two measures that have the following definitions:
Total Population = Sum(‘Population’[PopulationAmount])
2023 Population = CALCULATE([Total Population], ‘Date'[Year] = 2023)
You create a table visual that displays Date[Year] and [2023 Population]. What will the table visual show?
A. one row per year that contains blank values for every year except 2023
B. one row per date that contains the population value for the corresponding year repeated in each row
C. a single row for the year 2023 that contains the related population value
D. one row per year that contains the same value repeated for each year
Answer: D
NEW QUESTION 367
You have a Microsoft Power BI report. The size of PBIX file is 550 MB. The report is accessed by using an App workspace in shared capacity of powerbi.com. The report uses an imported dataset that contains one fact table. The fact table contains 12 million rows. The dataset is scheduled to refresh twice a day at 08:00 and 17:00. The report is a single page that contains 15 AppSource visuals and 10 default visuals. Users say that the report is slow to load the visuals when they access and interact with the report. You need to recommend a solution to improve the performance of the report. What should you recommend?
A. Change any DAX measures to use iterator functions.
B. Implement row-level security (RLS).
C. Replace the default visuals with AppSource visuals.
D. Split the visuals onto multiple pages.
Answer: D
NEW QUESTION 368
You have a Power BI report that imports a date table and a sales table from an Azure SQL database data source. The sales table has the following date foreign keys:
– Due Date
– Order Date
– Delivery Date
You need to support the analysis of sales over time based on all three dates at the same time.
Solution: From the Fields pane, you rename the date table as Due Date. You use a DAX expression to create Order Date and Delivery Date as calculated tables. You create active relationships between the sales table and each date table.
Does this meet the goal?
A. Yes
B. No
Answer: A
NEW QUESTION 369
You have data in a Microsoft Excel worksheet as shown in the following table:
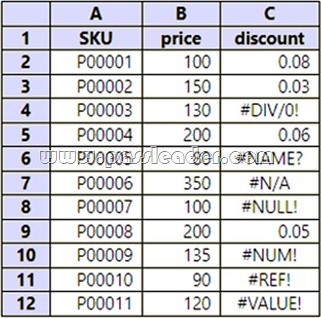
You need to use Power Query to clean and transform the dataset. The solution must meet the following requirements:
– If the discount column returns an error, a discount of 0.05 must be used.
– All the rows of data must be maintained.
– Administrative effort must be minimized.
What should you do in Power Query Editor?
A. Select Replace Errors.
B. Edit the query in the Query Errors group.
C. Select Remove Errors.
D. Select Keep Errors.
Answer: A
Explanation:
By selecting “Replace Errors” in Power Query Editor, you can specify a value (in this case, 0.05) to be used whenever an error is encountered in the specified column (discount column). This ensures that if the discount column returns an error, a discount of 0.05 will be used, while maintaining all rows of data and minimizing administrative effort.
NEW QUESTION 370
You use Power Query Editor to import and preview sales data from the years 2020 and 2021 in a Microsoft Excel file as shown in the following exhibit:
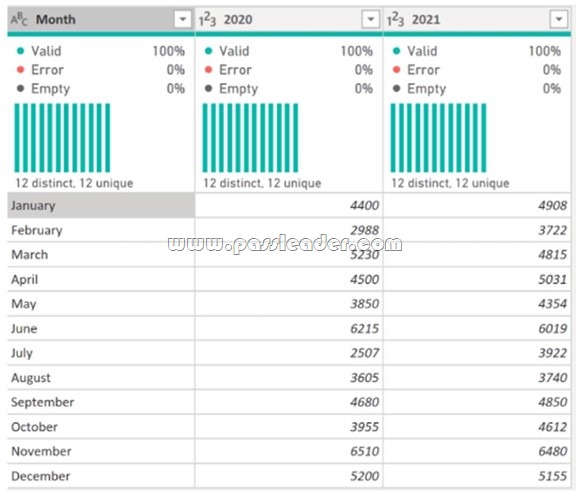
You need to shape the query to display the following three columns:
– Month
– Sales
– Year
What should you select in Power Query Editor?
A. Merge columns.
B. Transpose.
C. Unpivot columns.
D. Pivot column.
Answer: C
Explanation:
To shape the query to display the required three columns (month, sales,year), you should select the “Unpivot columns” option in Power Query Editor. This will transfer the data from its current columnar structure (where each year is a separate column) into a tabular format with separate rows for each combination of Month, Sales, and Year.
NEW QUESTION 371
HotSpot
You have a Power BI report that contains a page. The page contains the following visuals:
– A card.
– A matrix.
– A bar chart.
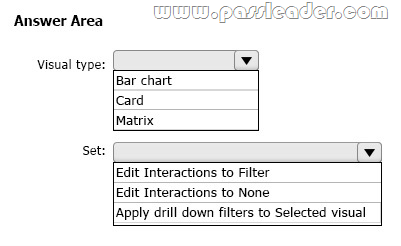
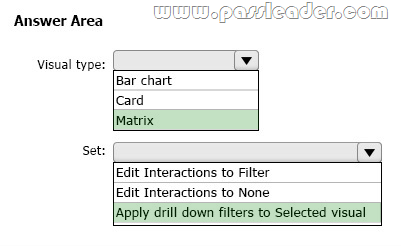
You need to configure the page to ensure that the card and the bar chart are unaffected when a user drills down in the matrix. The card and the bar chart must change when a user selects a cell in the matrix. What should you configure? (To answer, select the appropriate options in the answer area.)
Answer:
Explanation:
By default, a matrix will have “Entire Page” in the “Apply drill down filters to” option inside the Format tab, which is what we don’t want to happen, so changing to “Selected Visual” should give us the behavior we want.
https://learn.microsoft.com/en-us/power-bi/create-reports/service-reports-visual-interactions?tabs=powerbi-desktop#change-the-interactions-of-drillable-visualizations
NEW QUESTION 372
HotSpot
You have a Power BI model that contains the following data:

The Date table relates to the Sales table by using the Date columns. You need to create a calculated table that will contain the following:
– A row for each year.
– A column that contains the total sales per year.
How should you complete the DAX calculation? (To answer, select the appropriate options in the answer area.)

Answer:

Explanation:
https://learn.microsoft.com/en-us/dax/summarize-function-dax
NEW QUESTION 373
Drag and Drop
You need to use AI insights to add a column of enhanced data based on the customer feedback. The solution must identify the following:
– What the customers most often provide feedback about.
– Whether the customers like your company’s product.
– The language of the feedback.
Which AI insights service should you use for each output? (To answer, drag the appropriate services to the correct outputs. Each service may be used once, more than once, or not at all. You may need to drag the split bar between panes or scroll to view content.)

NEW QUESTION 374
Drag and Drop
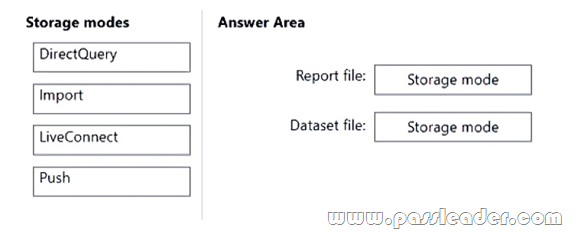
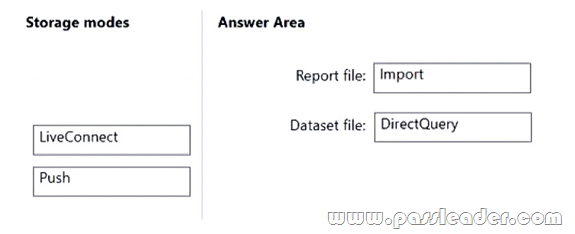
You have two Microsoft Excel workbooks in a Microsoft OneDrive folder. Each workbook contains a table named Sales. The tables have the same data structure in both workbooks. You plan to use Power BI to combine both Sales tables into a single table and create visuals based on the data in the table. The solution must ensure that you can publish a separate report and dataset. Which storage mode should you use for the report file and the dataset file? (To answer, drag the appropriate modes to the correct files. Each mode may be used once, more than once, or not at all. You may need to drag the split bar between panes or scroll to view content.)
Answer:
Explanation:
– Report file: Import: In Power BI, when you import data, it means that the data is loaded into the Power BI Desktop file. In this case, you would import the data from both Excel workbooks into your Power BI Desktop report file. This allows you to create visuals and reports based on the imported data. Importing the data ensures that you can work with the data even when you’re not connected to OneDrive.
– Dataset: DirectQuery: To keep the data in OneDrive and maintain a live connection to the source, you should use DirectQuery for the dataset. DirectQuery allows Power BI to retrieve and query data from the original data source (in this case, the Excel workbooks in OneDrive) in real-time without importing it into the dataset. This ensures that your dataset is always up-to-date and reflects changes made to the source data.
NEW QUESTION 375
……
Get the newest PassLeader PL-300 VCE dumps here: https://www.passleader.com/pl-300.html (387 Q&As Dumps –> 431 Q&As Dumps –> 467 Q&As Dumps)
And, DOWNLOAD the newest PassLeader PL-300 PDF dumps from Cloud Storage for free: https://drive.google.com/drive/folders/1DTxKJGzNsJ4r5NDQC2vCwfjY0k1ytMgJ
